Understand when your business is busiest and how customers are ordering.Documentation Index
Fetch the complete documentation index at: https://docs.ofatoura.com/llms.txt
Use this file to discover all available pages before exploring further.
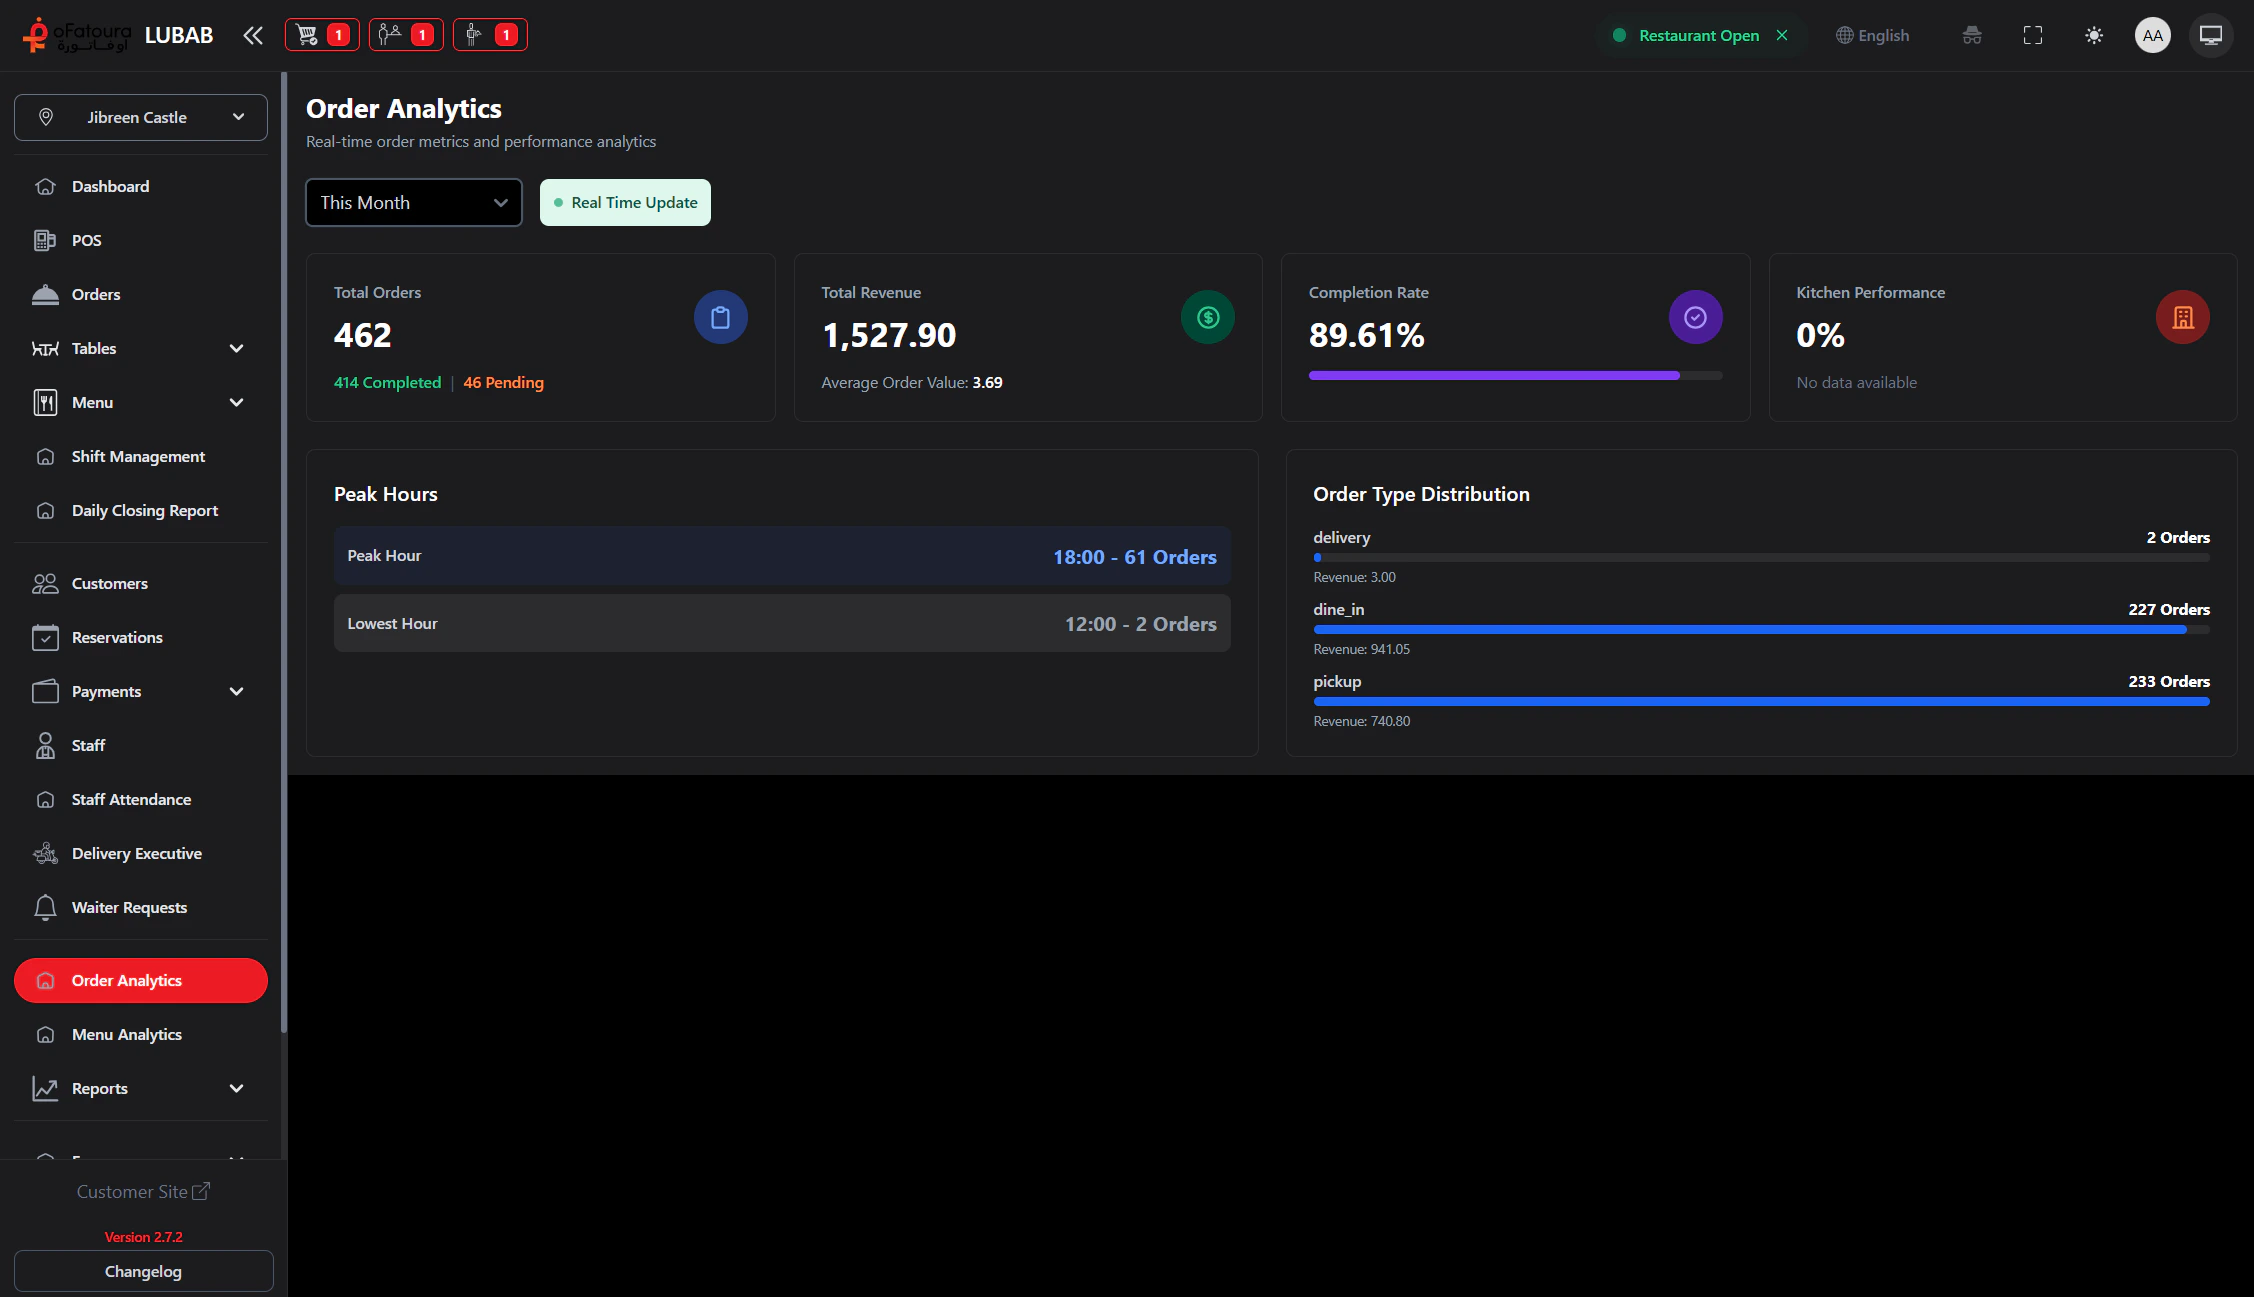
Key Metrics
- Order Volume: Total, completed, pending, and cancelled orders.
- Revenue: Total revenue and average order value.
- Peak/Low Hours: Busiest and slowest order time slots.
- Order Types: Distribution by order type (for example dine-in, delivery, takeaway).
Viewing Analytics
Filter
- Date Range: Use Today, This Week, or This Month.
- Branch: If your restaurant has multiple branches, filter to a specific branch or view all.
Pro Tip: Use completion rate and peak-hour data together to improve staffing during rush periods.
Sales Report
Revenue focus
Menu Analytics
Item performance