See which sections of your menu are driving success.Documentation Index
Fetch the complete documentation index at: https://docs.ofatoura.com/llms.txt
Use this file to discover all available pages before exploring further.
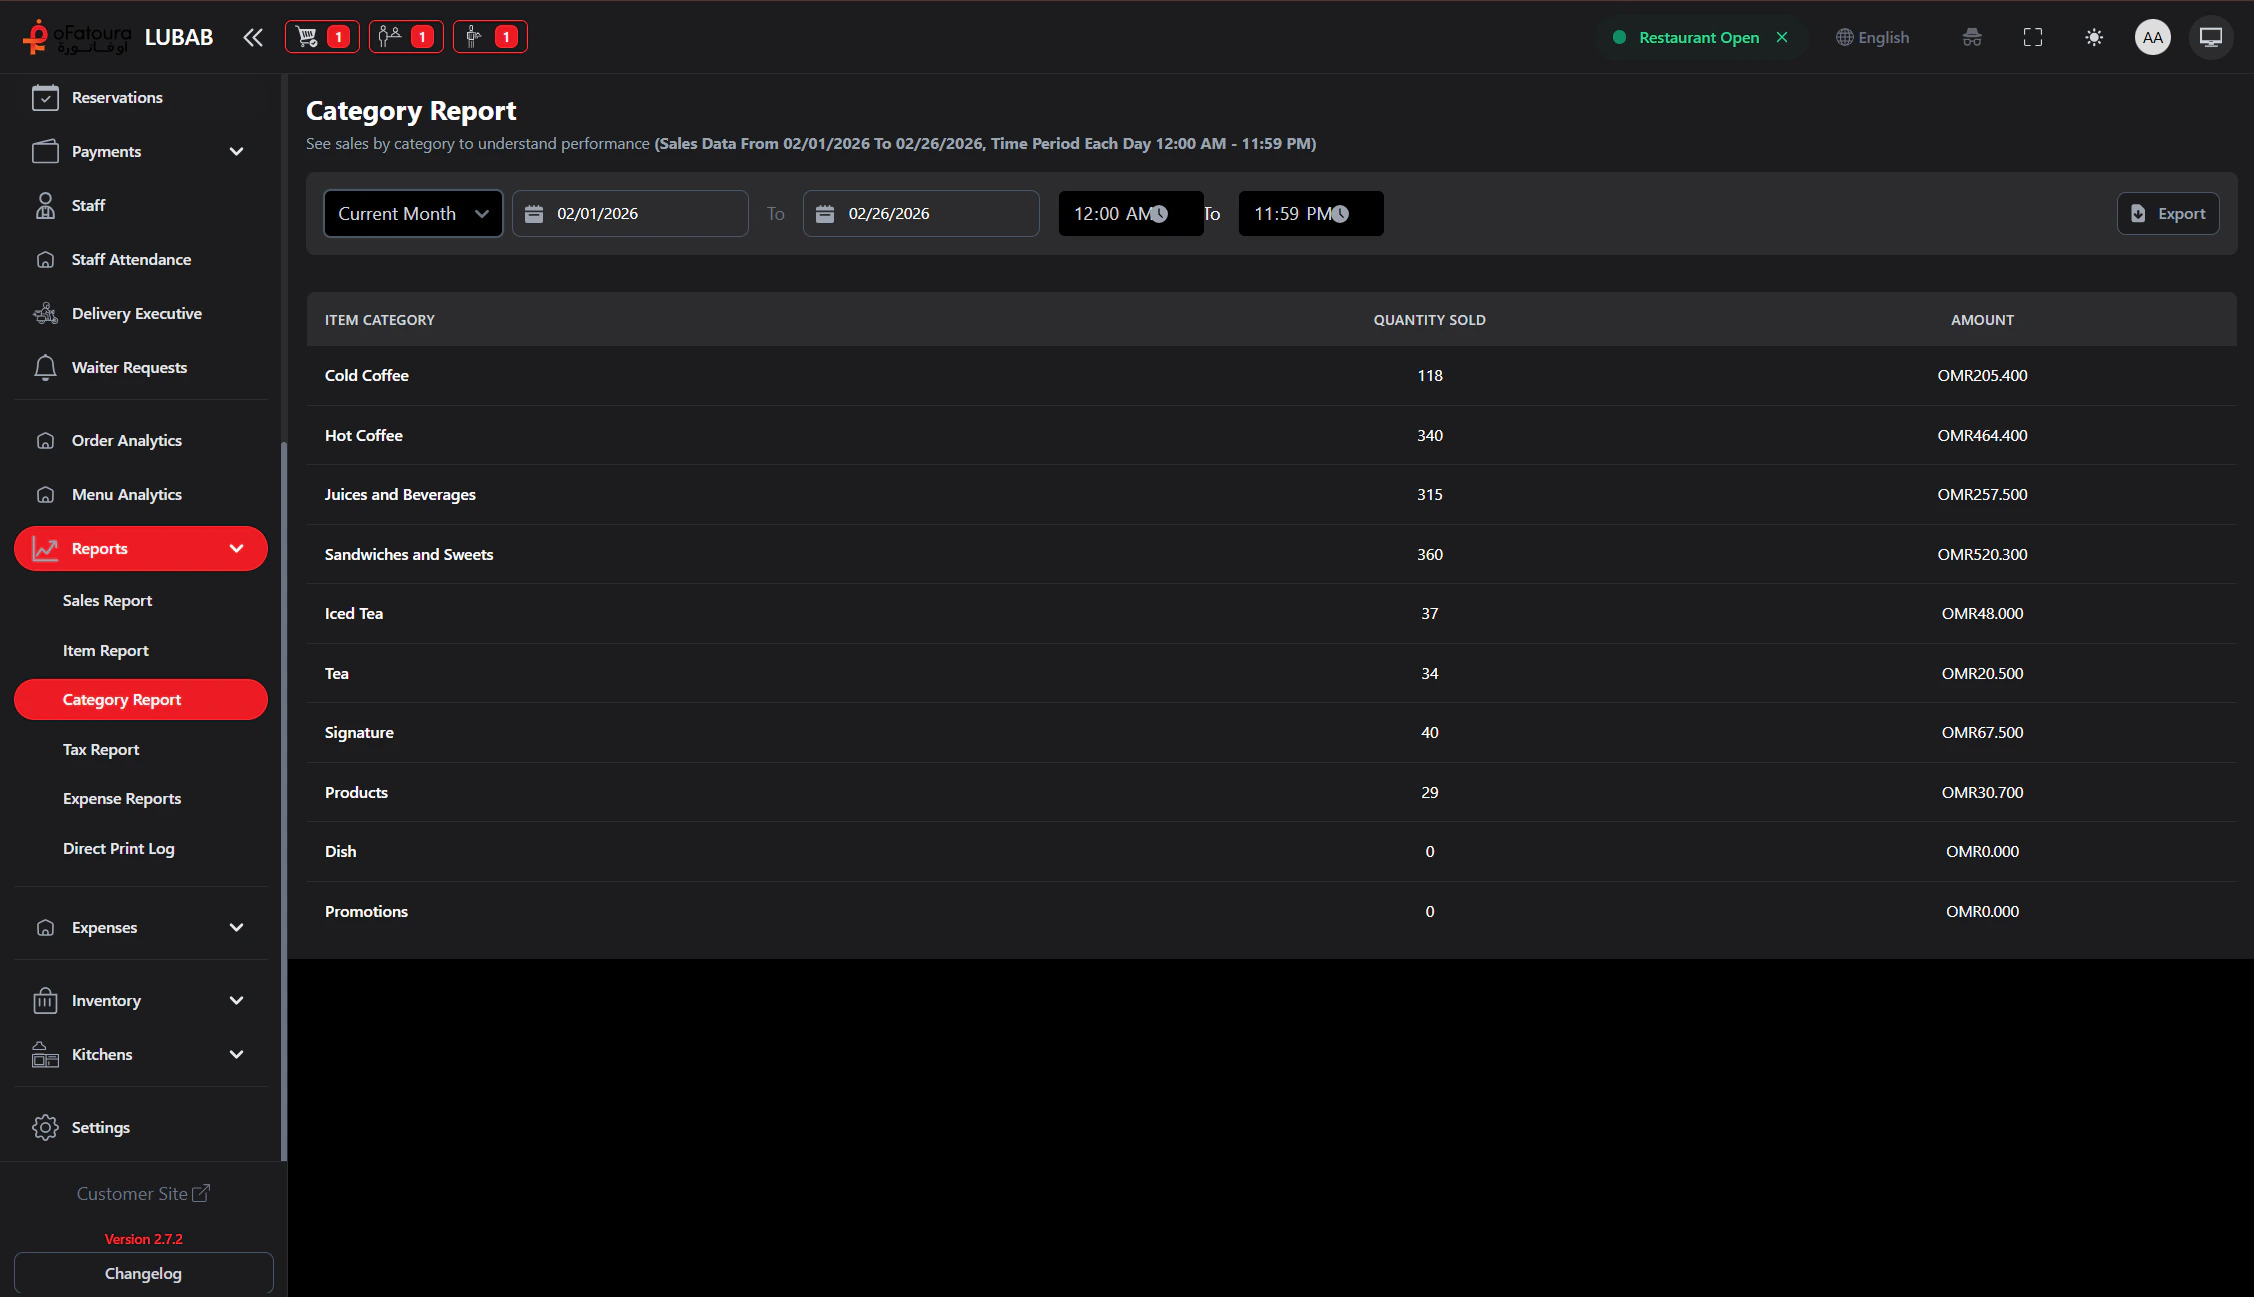
Sales by Department
- Category Name: Menu category.
- Quantity Sold: Total quantity sold in each category.
- Amount: Total revenue per category.
Viewing the Report
Pro Tip: If “Uncategorized” sales are high, review your item setup to ensure everything belongs to a proper group.
Item Categories
Manage groups
Sales Report
Total revenue