Menu Analytics helps you understand how guests interact with your menu and where conversions happen.Documentation Index
Fetch the complete documentation index at: https://docs.ofatoura.com/llms.txt
Use this file to discover all available pages before exploring further.
Insights
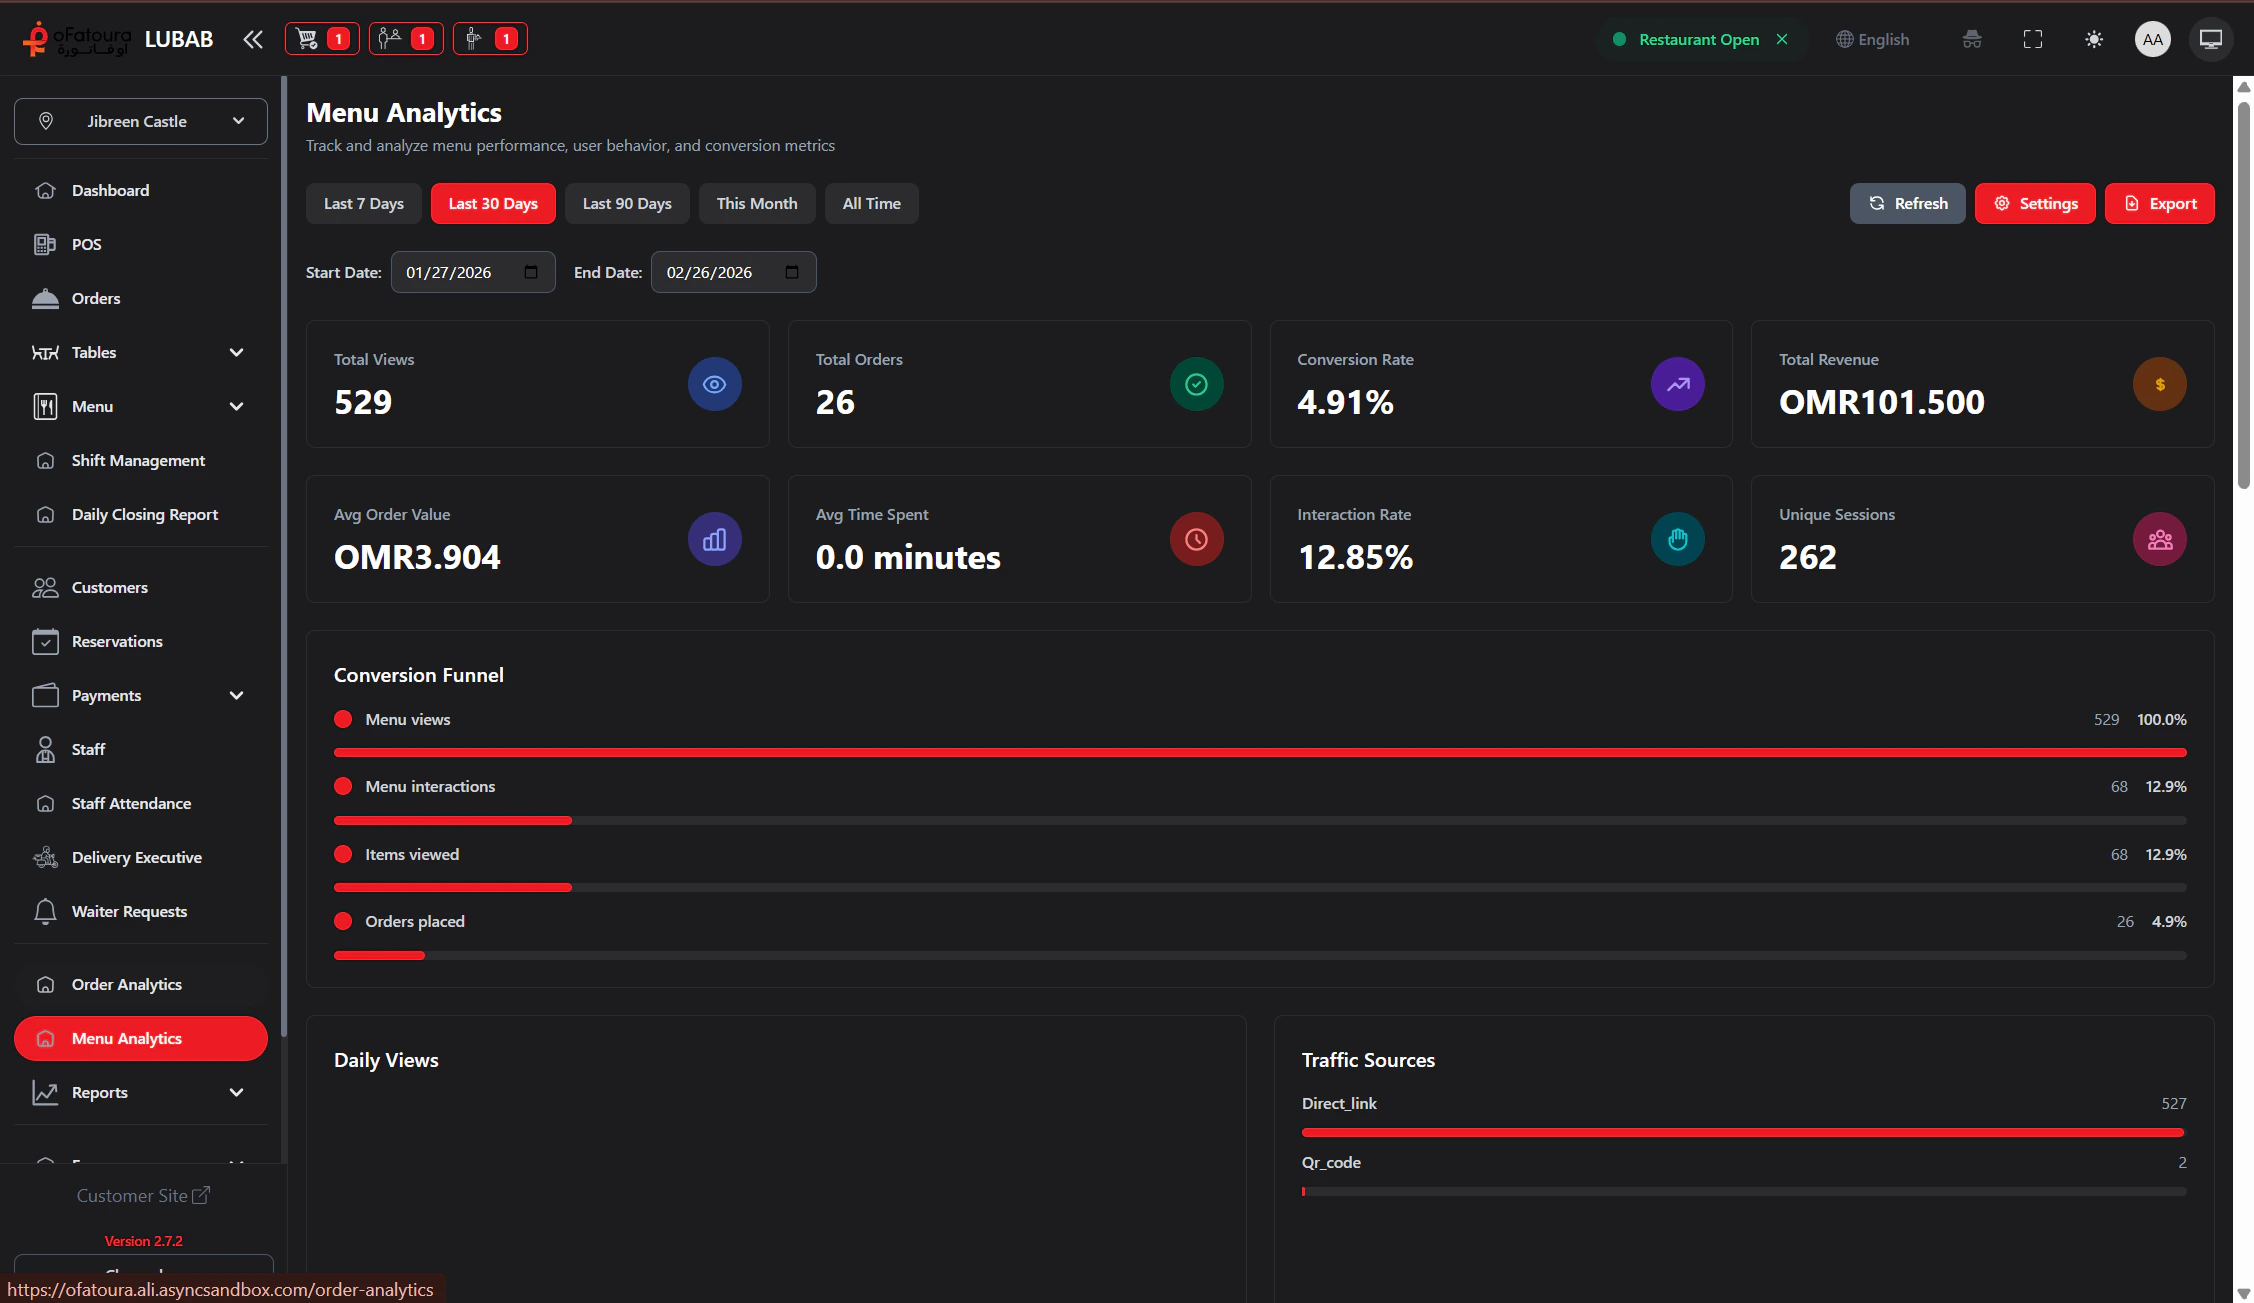
- Views and sessions: How much traffic your menu receives.
- Orders and revenue: Conversion outcomes from menu visits.
- Engagement metrics: Average time spent and interaction rate.
- Breakdowns: Daily trends, traffic sources, device types, and category performance.
Analyzing Performance
Set Period and Scope
- Use quick period buttons (Last 7/30/90 days, This Month, All Time), or set a custom start/end date.
- Select the branch you want to analyze.
Review Dashboard
Review summary cards, conversion funnel, trend charts, and traffic/device/category sections.
Optional Settings
Use the Settings modal to control analytics tracking options (for example device info, referrer, and data retention).
Use conversion rate and interaction metrics together when deciding menu updates or promotion priorities.
Item Report
Drill into item-level sales
Menu Setup
Update pricing, availability, and categories