Granular analysis of every item sold.Documentation Index
Fetch the complete documentation index at: https://docs.ofatoura.com/llms.txt
Use this file to discover all available pages before exploring further.
Report Data
- Item Name: Item with variation (if variations exist).
- Category: Item category.
- Quantity Sold: Number of units sold.
- Selling Price: Effective selling price (including discounted average when applicable).
- Total Revenue: Total amount generated per item/variation.
Generating the Report
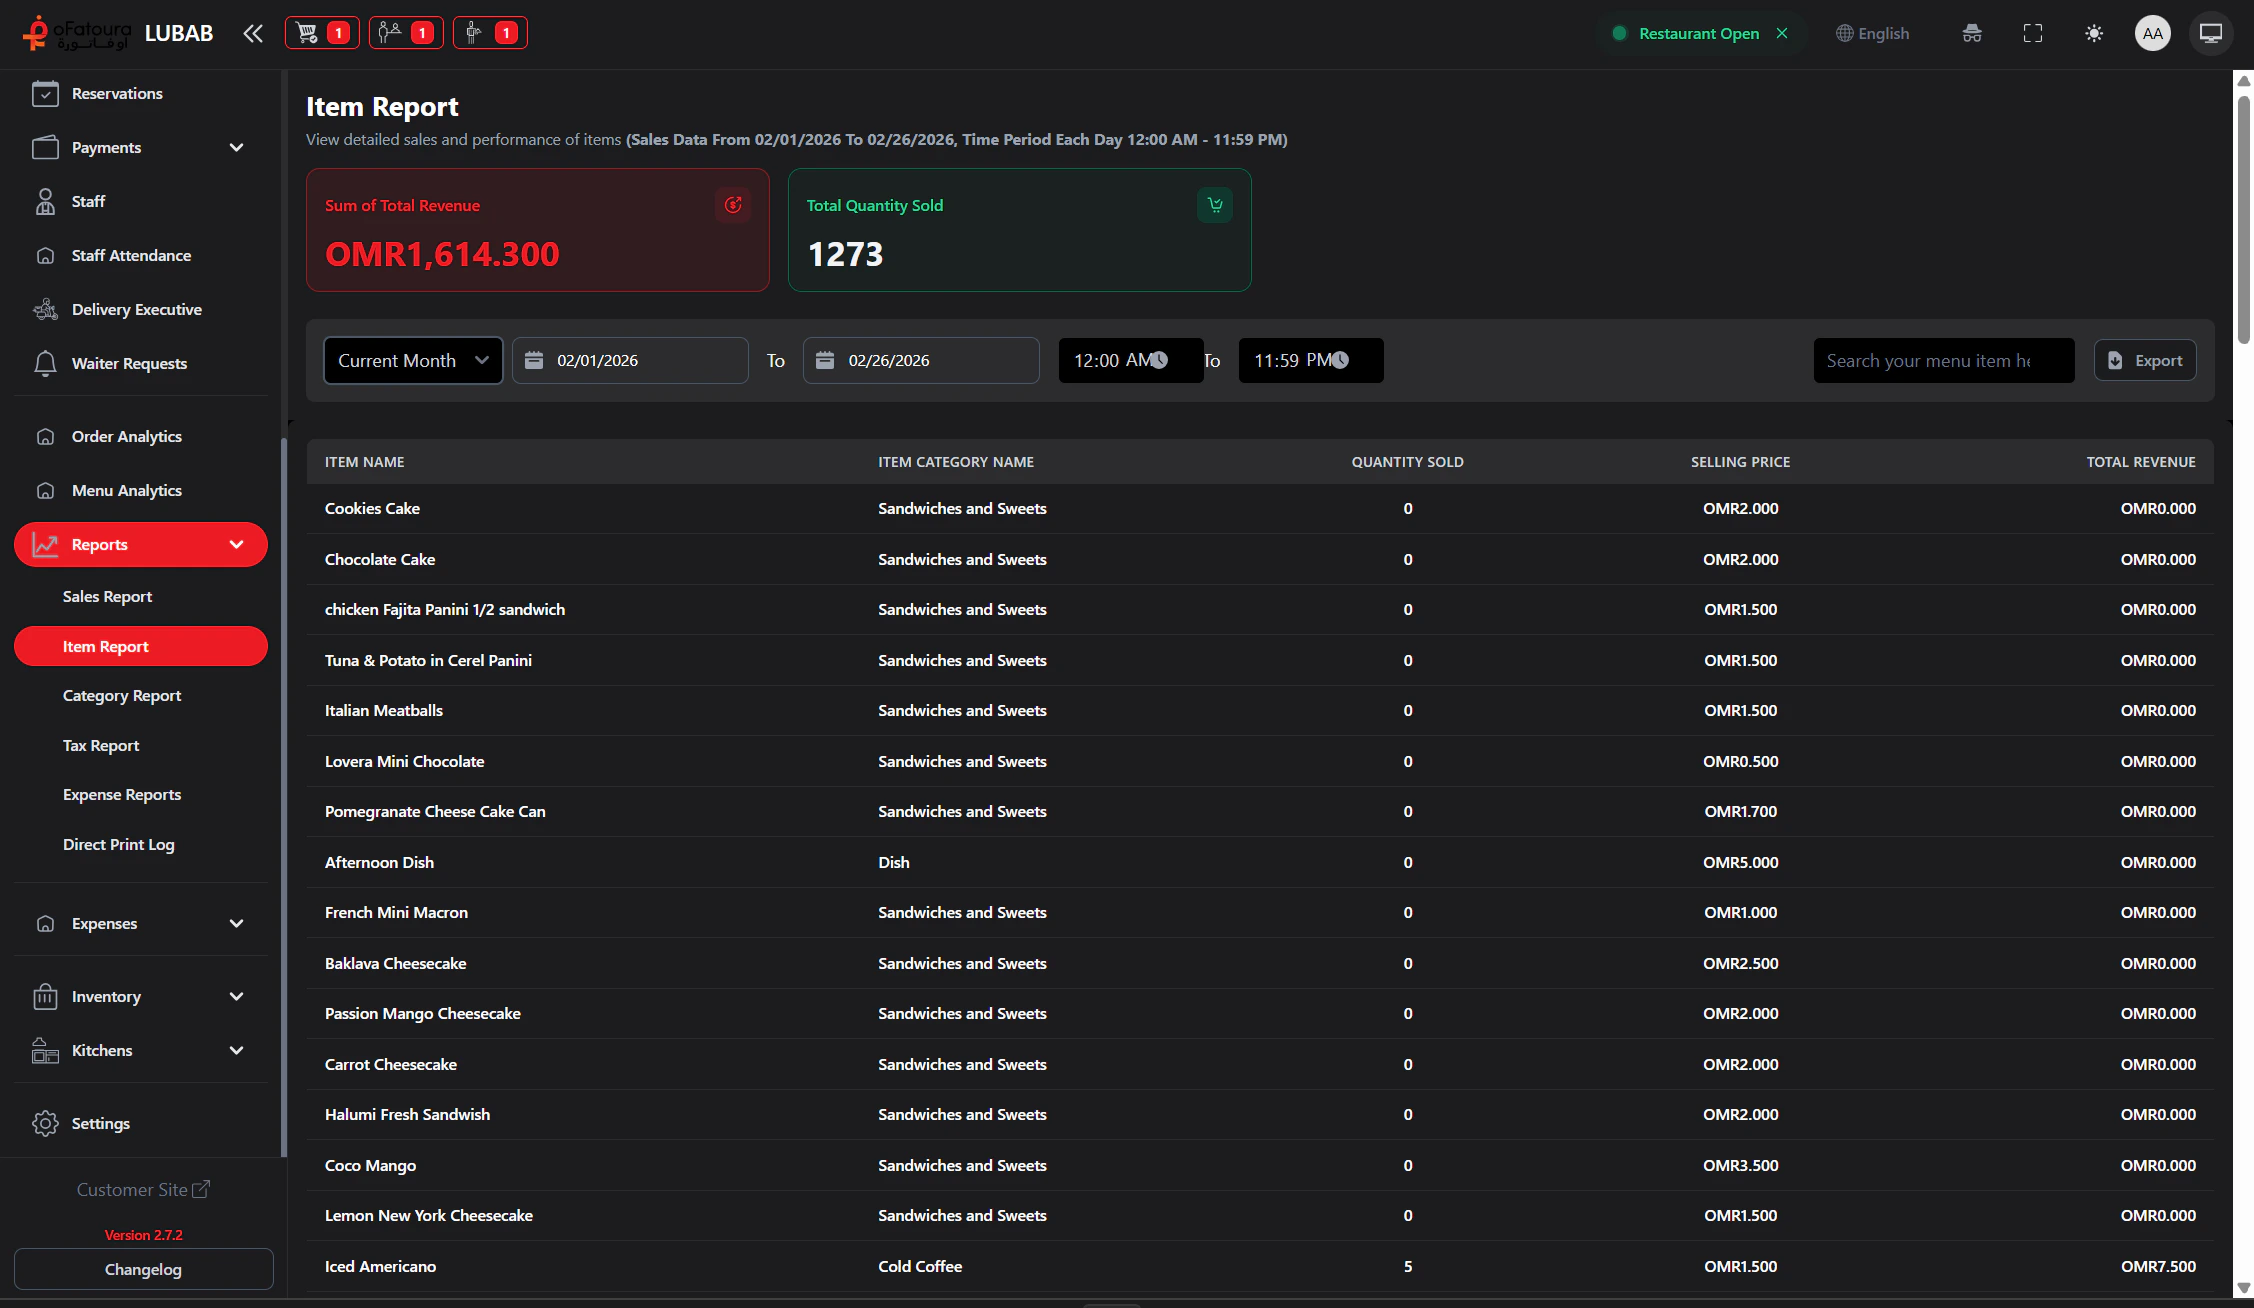
Filter
- Date Range: Use preset ranges or custom start/end date.
- Time Range: Set start and end time.
- Search: Find a specific item or category.
Pro Tip: Use this report to decide which items to feature in promotions.
Menu Analytics
Overall performance
Inventory Management
Check stock levels (if Inventory is enabled)